
We are pleased to share the latest statistics from Google Analytics for the PRIDA website, covering the period between April and July 2023. On April 10th, 2023, Google Analytics was successfully installed on the PRIDA website, allowing us to gain valuable insights into our website's performance and audience engagement.
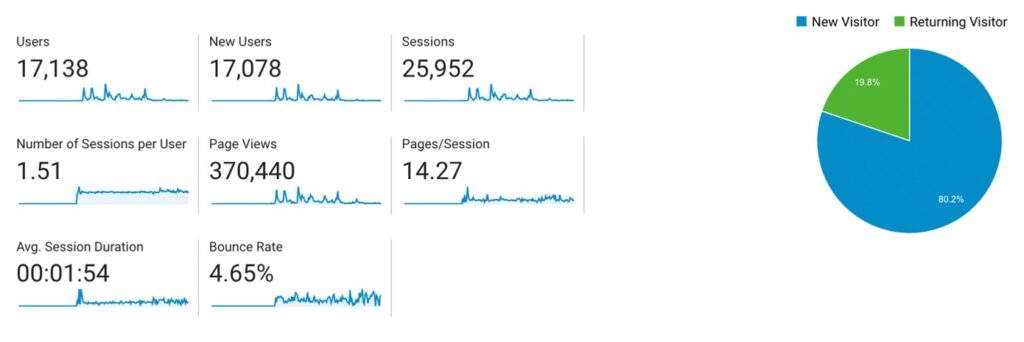
During this period, we recorded a total of 17,138 users who visited the PRIDA website. These users generated an impressive number of page views, reaching 370,440. On average, visitors spent approximately 1 minute and 54 seconds per session on the website, indicating strong user engagement.
The top 10 countries contributing to the website traffic are as follows:
Our website caters primarily to an English-speaking audience, with English being the preferred language for 75% of visitors. The remaining 25% of visitors prefer French as their language of choice.

Regarding gender representation, male visitors accounted for 47.3% of the total website traffic, while female visitors constituted 52.7%.
In terms of demographics, the age group distribution of website visitors is as follows:
Notably, 90% of our website traffic originated from the newsletter, indicating the significance of our communication efforts. Social media contributed 5% of the traffic, while the ITU website accounted for 2% of the visits.
Among the various pages on the website, the press release on spectrum management for young women stood out as particularly popular, attracting 61% of English-speaking visitors and 24% of French-speaking visitors, totaling 85% of the website's overall traffic.
Additionally, we observed certain affinity categories among our audience. Technology/Technophiles and Technology/Mobile Enthusiasts were the two most prominent affinity categories, accounting for 8.88% and 5.90% of our visitors, respectively.
We are delighted with the positive response and engagement we have received from our global audience. The insights will continue to inform our efforts to enhance the user experience and deliver relevant content to our diverse community.
We extend our gratitude to all participants and stakeholders for their continued support, and we look forward to further growth and success on our PRIDA journey.
A joint initiative of the AU, EU and ITU